📈 GBP/USD – Elliott Wave Insight (Daily)
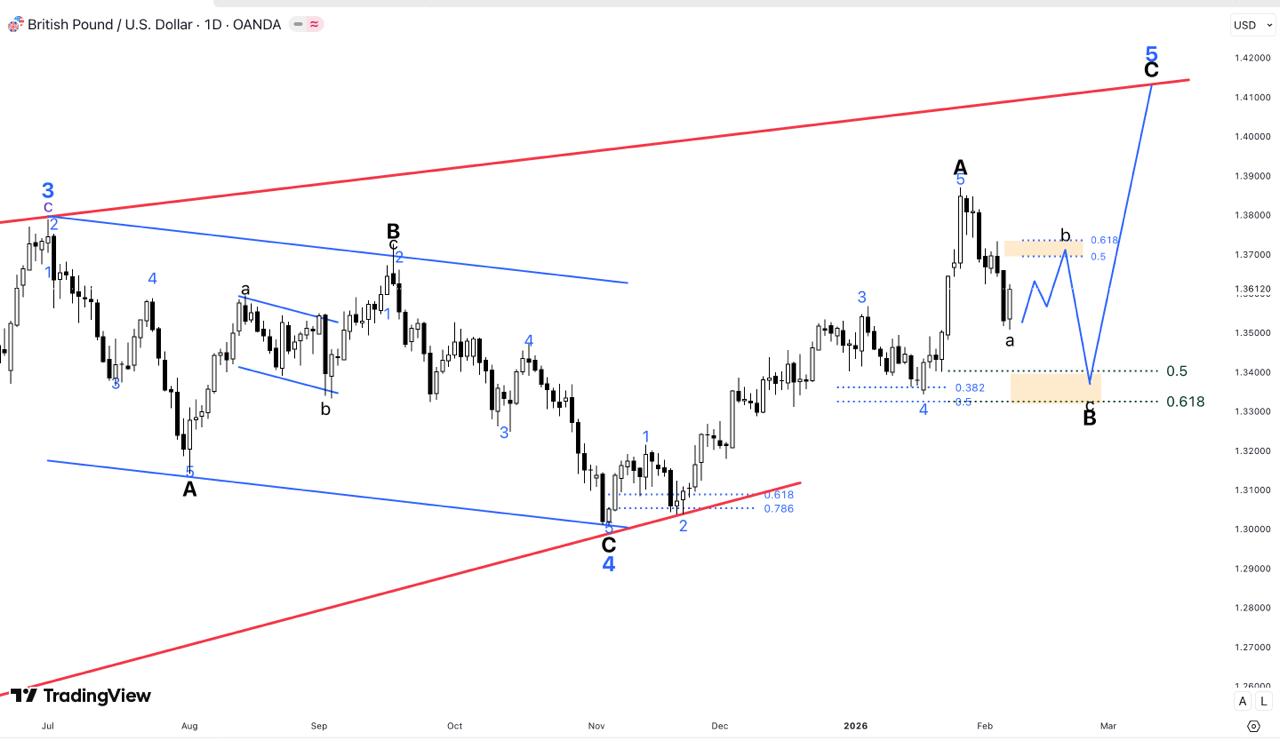
🔍 Market Structure
GBP/USD is trading within a rising channel, and the recent decline completed a corrective ABC pattern, finding strong support near the lower channel boundary and key Fibonacci levels (0.618–0.786).
🌊 Elliott Wave Outlook
-
Wave C appears complete, signaling the end of correction
-
A new impulsive wave is developing from the recent low
-
Price action suggests Wave (3) may be forming, typically the strongest phase of an Elliott Wave cycle
🎯 Key Levels
-
Support: Wave B zone (0.5–0.618 Fib)
-
Invalidation: Daily close below corrective low
-
Targets: Prior highs and upper channel resistance (Wave 5 projection)
✅ Bias
As long as price holds above support, the bullish Elliott Wave scenario remains valid, with upside potential toward higher highs.
More Insights
- 18/01/2026in Forex, Market Insights
EUR/NZD: Wave 3 Decline to 1.4500 – Major Short!
📉 EUR/NZD: Bearish Wave 3 to 1.4500!... - 18/01/2026in Forex, Market Insights
USD/CHF: WXY Complete – Rally to 0.9500!
🇨🇭 USD/CHF: Bullish Breakout to 0.9500!... - 18/01/2026in Forex, Market Insights
CAD/JPY: Bearish Reversal – 1,500 Pip Drop Coming!
📉 CAD/JPY: Major Correction to 95.00!... - 18/01/2026in Market Insights, Synthetic Indices
CRASH 500: Bearish Reversal to 1,800!
📉 CRASH 500: Major Drop to 1,800!... - 18/01/2026in Crypto, Market Insights
SOLANA: $500 Wave 5 Rocket – Altcoin Season Alert!
🚀 SOLANA: Prepare for Liftoff to $500+!...