🚀 BOOM 500: Deep Correction Complete - Massive Rally Loading!
📊 Market Overview
Timeframe: Daily Chart (D1)
Market: Boom 500 Index
Bias: BULLISH 🟢
📈 Wave Analysis
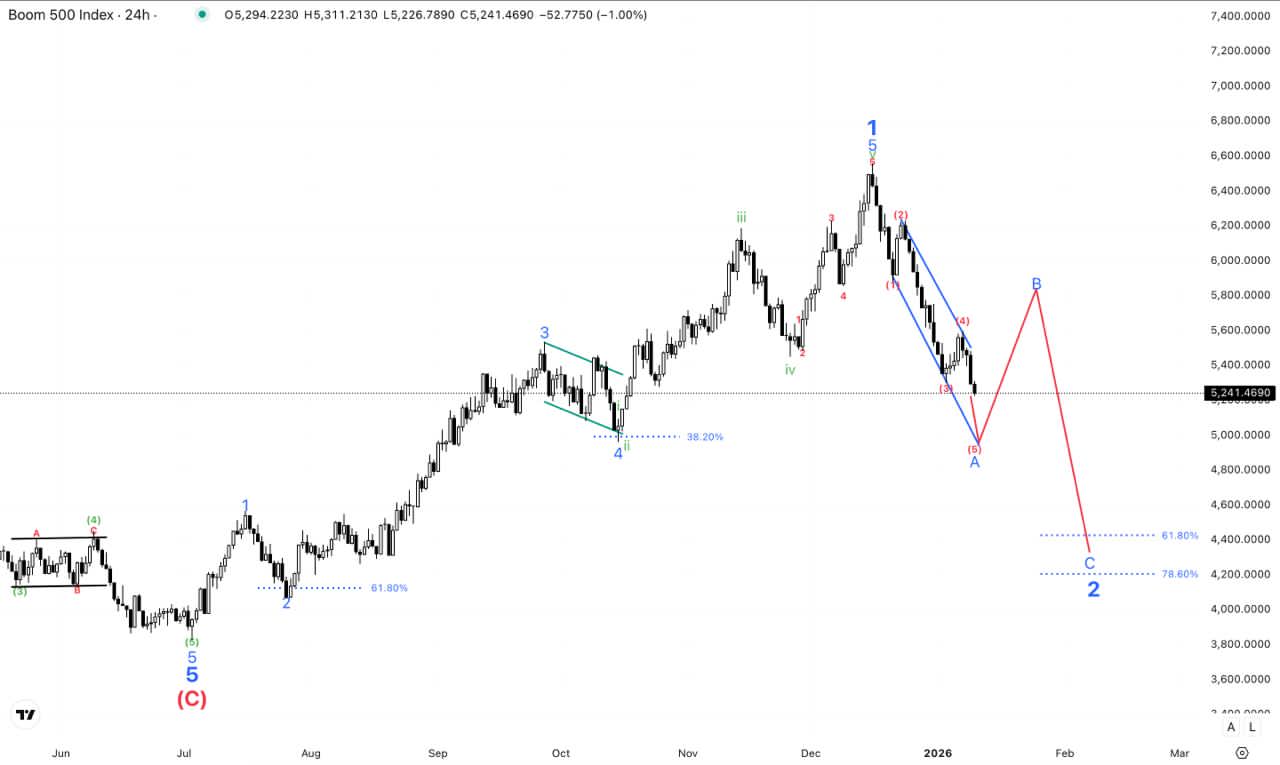
The Boom 500 has completed a powerful five-wave impulse structure, reaching highs around 6,800.
Now in a deep Wave (2) correction, the market is forming an ABC pattern targeting the
4,200-4,300 zone.
Current Structure:
- ✅ Waves 1-3-5 completed to 6,800 peak
- ⏳ Wave A decline finished
- 🔄 Wave B bounce currently forming
- 🎯 Wave C expected to 4,200-4,300 support
🎯 Key Trading Levels
Support Zones:
- 🟨 4,200 - 4,300 (Wave 2 target - HIGH PROBABILITY BUY ZONE)
- 🔴 Below 3,600 invalidates bullish count
Resistance/Targets:
- 5,200 (50% Fibonacci)
- 🎯 7,400+ (Wave 3 projection after reversal)
💡 Trading Strategy
Setup: Wait for Wave C completion at 4,200-4,300
Entry: 4,200-4,300 zone with reversal confirmation
Stop Loss: Below 3,600
Target: 7,400+
Risk/Reward: 1:5 ratio 🔥
⚡ Bottom Line
Boom 500 is setting up for a textbook Wave (3) rally after completing its correction. The
4,200-4,300 zone offers an exceptional risk-reward opportunity for patient traders. Watch for bullish reversal
signals at support!
More Insights
- 09/02/2026in Forex, Market Insights
GBPUSD 1D UPDATE
The GBP/USD pair is currently developing a clear Elliott Wave structure on the Daily timeframe, suggesting that the market is transitioning from a corrective phase into a potential impulsive bullish continuation.... - 18/01/2026in Forex, Market Insights
EUR/NZD: Wave 3 Decline to 1.4500 – Major Short!
📉 EUR/NZD: Bearish Wave 3 to 1.4500!... - 18/01/2026in Forex, Market Insights
USD/CHF: WXY Complete – Rally to 0.9500!
🇨🇭 USD/CHF: Bullish Breakout to 0.9500!... - 18/01/2026in Forex, Market Insights
CAD/JPY: Bearish Reversal – 1,500 Pip Drop Coming!
📉 CAD/JPY: Major Correction to 95.00!... - 18/01/2026in Market Insights, Synthetic Indices
CRASH 500: Bearish Reversal to 1,800!
📉 CRASH 500: Major Drop to 1,800!...