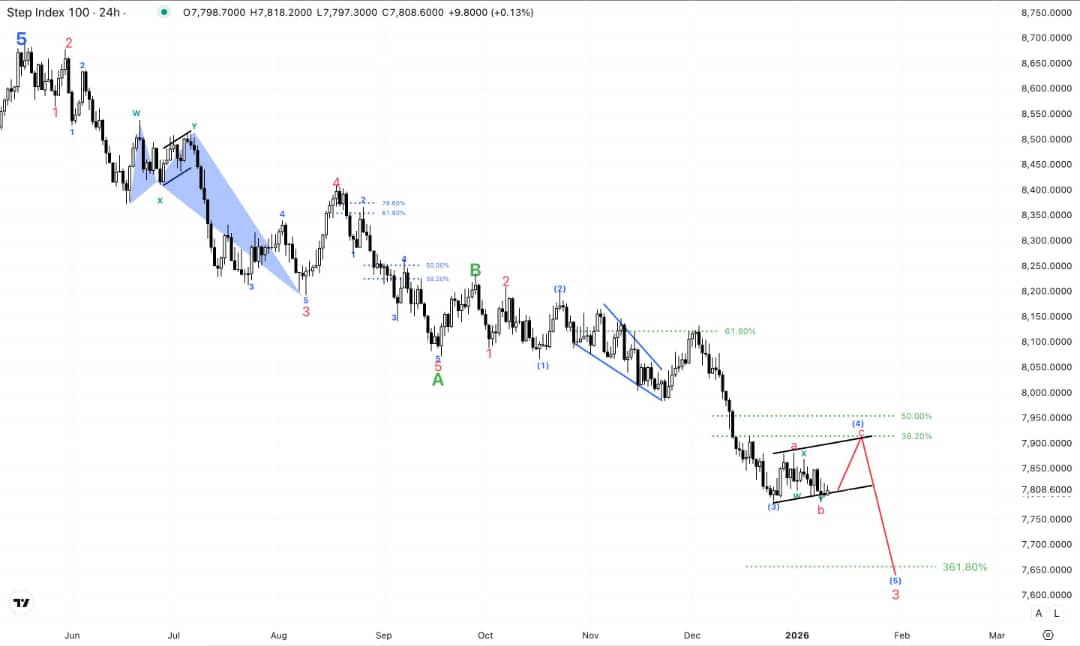
📉 STEP 100: Wave B Resistance at 7,600!
📊 Market Overview
Timeframe: Daily | Market: Step Index 100 | Bias: BEARISH 🔴
📉 Wave Structure
After Wave A to 6,500, Wave B bounce facing resistance at 7,500-7,600. Short
setup!
Key Levels:
- 🎯 Short: 7,500-7,600
- 📉 Target: 7,000, then 6,800
- 🔴 Stop: Above 7,800
🎯 Trading Plan
Entry: 7,500-7,600 | Stop: Above 7,800 | Target: 6,800-7,000
⚡ Correction Play
Wave B resistance creates shorting opportunity!
More Insights
- 09/02/2026in Forex, Market Insights
GBPUSD 1D UPDATE
The GBP/USD pair is currently developing a clear Elliott Wave structure on the Daily timeframe, suggesting that the market is transitioning from a corrective phase into a potential impulsive bullish continuation.... - 18/01/2026in Forex, Market Insights
EUR/NZD: Wave 3 Decline to 1.4500 – Major Short!
📉 EUR/NZD: Bearish Wave 3 to 1.4500!... - 18/01/2026in Forex, Market Insights
USD/CHF: WXY Complete – Rally to 0.9500!
🇨🇭 USD/CHF: Bullish Breakout to 0.9500!... - 18/01/2026in Forex, Market Insights
CAD/JPY: Bearish Reversal – 1,500 Pip Drop Coming!
📉 CAD/JPY: Major Correction to 95.00!... - 18/01/2026in Market Insights, Synthetic Indices
CRASH 500: Bearish Reversal to 1,800!
📉 CRASH 500: Major Drop to 1,800!...